Who makes this, and why?
Why we do this
It started with one question, and it was not a grand one.
What does a square meter cost in a particular Italian town, how many people live there, and is that number going up or down?
That turned out not to be answerable in an evening.
Italy is not the difficulty. The country places fifth in the EU for open data maturity, and ISTAT publishes a documented API. The raw material is genuinely there. What took the time was everything downstream of publication: property prices that need a login to pull in bulk, figures left stale for years, zeros in the file that mean “no market to survey” rather than “free,” and national averages that quietly cover regions where the coverage underneath is too thin to support a claim.
Publishing data and making it usable are two different problems. Almost all of the work sits in the second one.
So this site does that second part in the open. Comune by comune, with the source, the reference year and the coverage attached to every number, and nothing filled in that we do not actually have.
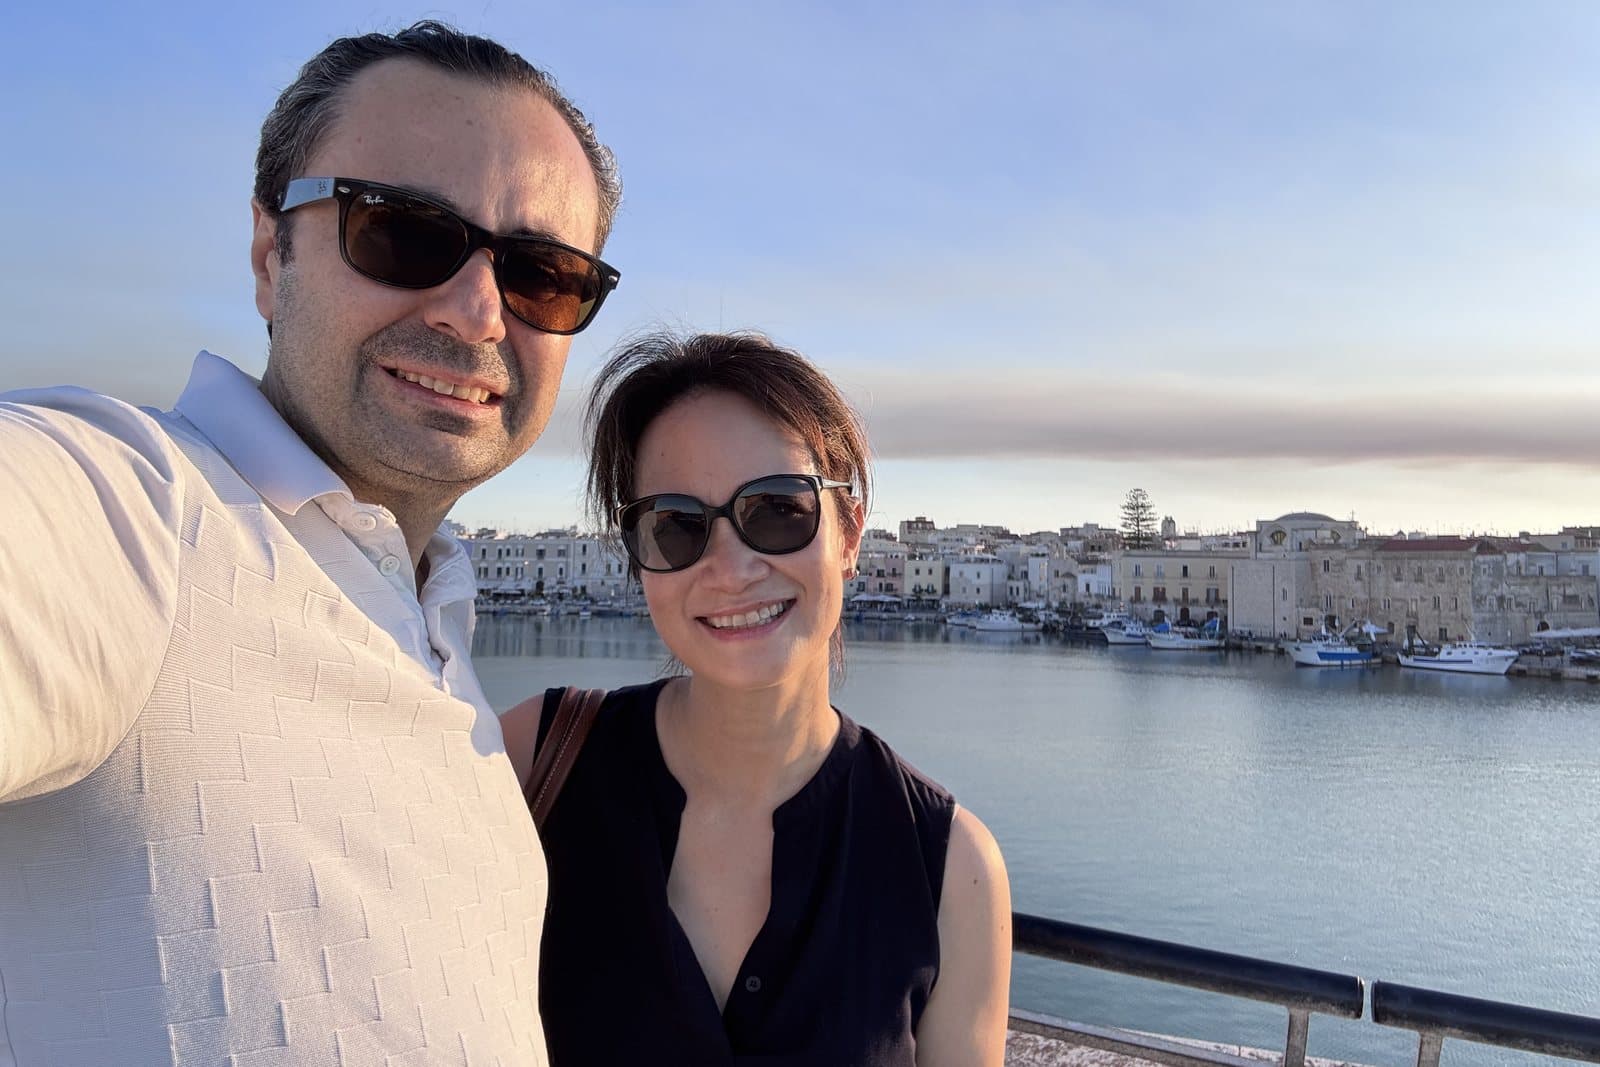
Caitlin writes it. Eugenio builds it. It is a personal project of ours, not a company product.
What is actually here
Italian data at the grain the decision is usually made at, which is smaller than most sources go.
Property prices, to buy and to rent, for each of the comuni Agenzia delle Entrate surveys — along with what refurbished housing costs above ordinary housing in the same town, and how many years of rent it takes to equal the purchase price.
Population: who lives in a comune, who arrived from abroad last year, whether the town is growing or emptying, and how old its residents are.
Well-being: ISTAT publishes 67 measures of it for all 107 province and deliberately never adds them into a single score. We show a curated 15 of them by default and let you look at the rest.
Tax and residency rules, encoded rather than summarized: which comuni admit a foreign pensioner to the 7% flat rate, and by which of the routes the statute allows.
And, more recently, the same kinds of measure across Europe at regional grain, so that Italy can be compared with Spain, Portugal, France or Greece rather than only with itself.
Some of it is not finished. Municipal and regional income tax surcharges are ingested but marked as drafts, which means they are not shown and not cited until someone has checked them properly. The page for each dataset says which state it is in.
Your assistant can read this too
Every page here has a version written for machines.
That means an AI assistant can read the same figures you would, with the source and the year attached, rather than assembling an answer about Italian house prices from whatever it happens to remember. If you use one for this kind of research, you can connect it once and then ask your questions in your own words.
It is worth saying what this does not do. An assistant reading our data still cannot tell you whether you qualify for anything. Personal eligibility for a tax regime or a visa turns on your own history, and no map can check that.
How we work
Every number carries its source, its reference year and the date we extracted it. If a place is missing from a dataset, the page says so directly. It never shows a zero standing in for “we do not have this.”
Sixteen Italian comuni have no price on our map for exactly that reason. Agenzia delle Entrate records zero for every zone in them, which means there is no market to survey rather than that housing is free. Fifteen are in the belt destroyed by the 2016 Central Italy earthquake — Amatrice, Accumoli, Arquata del Tronto, Norcia, Cascia and Preci among them — and the sixteenth is Gibellina, destroyed in 1968. Reading those zeros as prices would list the most devastated towns in Italy as its cheapest.
Tax and visa rules go through an extra step before they are marked as verified. We check the criteria against the legislation actually cited, comune by comune, rather than trusting a summary. A rule we have not finished checking stays labeled a draft and is left out of the site’s search rather than shipped a day early.
Where we rank or compare places, we use one method throughout: a place’s percentile position among the others, for that measure, in that year. It is the one normalization that keeps you comparing like with like, whether the underlying measure is a price, a wait time or a share of the population.
Very small places need care, so per-capita rankings start with a floor of 1,000 residents. Four foreign residents in a village of sixty is not a finding. You can move the floor yourself and watch what it does to the picture.
Caitlin
Caitlin is American, born in Vietnam and raised in New Jersey. Since studying at Berkeley she has lived in Vietnam, Paris, Amsterdam, New York, Miami, Seattle and Singapore. She speaks Italian, French, Spanish, Dutch and Vietnamese, and has always been drawn to new places, languages and ways of life. She writes here, out of a long-standing love of Italy and the idea of making a life there, and posts as @expatcat.it — she likes cats, and it was too close to her own name to pass up.
Eugenio
Eugenio is Italian and has lived and worked across Asia, Europe and the Americas. He works in tech, and builds the data side of this site in his own time. After many years abroad, returning to Italy is no longer a question of whether, but of when and where. This is his own odyssey.
When we get something wrong
Something in the data will turn out to be wrong sometimes. When it does, we correct it and say what changed and why, rather than quietly editing the page.
If you find a number that looks off — particularly about a town you know well — we would genuinely like to hear about it. Write to us.